I love real estate. And although I don’t have any rental houses in my portfolio yet, I am definetly in the market for some. So at the start of last year, I contacted a dear friend of mine who is a real estate agent and had him add me to the software he uses in order for me to get MLS data on opportunities that meet my search criteria.
Since then, I’ve gotten quite a few emails containing leads. And each time I review a set I get annoyed by how hard it is to examine the home’s relative location. So I decided I’d write a little program to help.
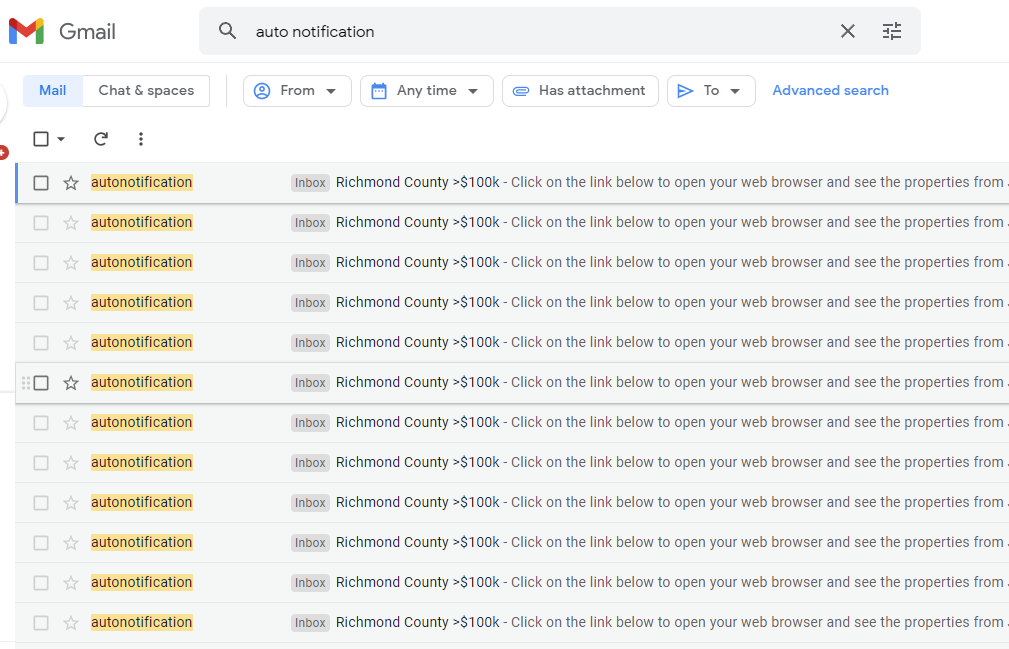
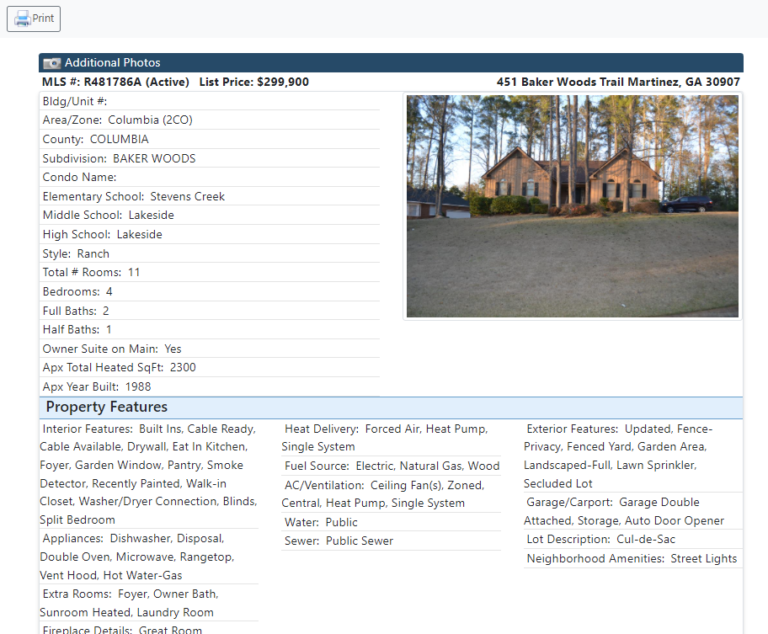
It’s too hard to review a lead’s relative location within the city by just its address.
Write a python script to extract the address and list price for each home in a lead package and export the data to excel for upload to Google My Maps.
					#Python 3.9.2

import requests
from bs4 import BeautifulSoup
import regex as re
import sys
import pandas as pd
import os
from datetime import datetime

url = sys.argv[1]
page = requests.get(url)
soup = BeautifulSoup(page.content, "html.parser")

address_s = soup.find_all('div', class_='pr-1 pl-1 d-xs-block d-md-inline float-md-right')
addresses = [i.text.replace('\n','') for i in address_s]

list_price_s = soup.find_all('div', class_='pr-1 pl-1 d-xs-block d-md-inline')
list_prices = []
for i in list_price_s:
	if 'List Price:' in i.text:
		list_prices.append(i.text.strip()[12:])

cost_categories = []
for i in list_prices:
	i = int(re.sub('[$,]','', i))
	# print(i)
	if i >= 200000:
		cost_categories.append('high')
	elif i < 200000 and i >= 100000:
		cost_categories.append('medium')
	elif i < 100000:
		cost_categories.append('low')

data_dict = {
	'addresses': addresses,
	'list_prices': list_prices,
	'cost_categories': cost_categories
	}

if os.path.exists(r"./navica_data"):
	os.chdir(r"./navica_data")
else:
	os.mkdir(r"./navica_data")
	os.chdir(r"./navica_data")
now = datetime.now().strftime("%y-%m-%d %H-%M-%S")
df = pd.DataFrame.from_dict(data_dict)
df.to_excel(f'{now}.xlsx')


#create master datalist from all Navica data collected to date, not just this iteration.
df_list = []
for i in os.listdir():
	if not i == 'all_data.xlsx':
		df = pd.read_excel(i, index_col=0)
		df_list.append(df)

df = pd.concat(df_list).drop_duplicates()
df.to_excel('all_data.xlsx', index=False)
Here is how to use the script and insert it into Google My Maps.
Create a new folder, copy and paste the code above into a text editor and save the file as main.py
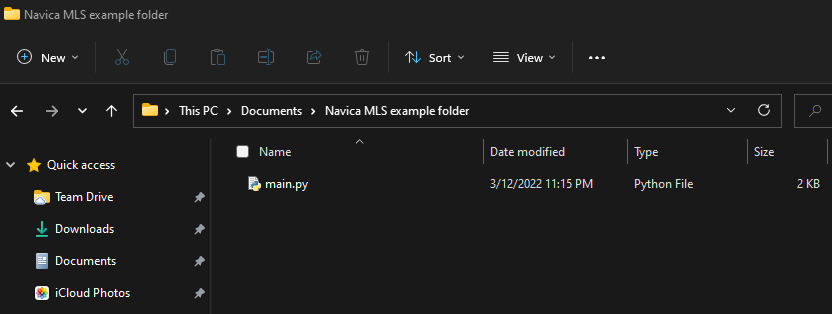
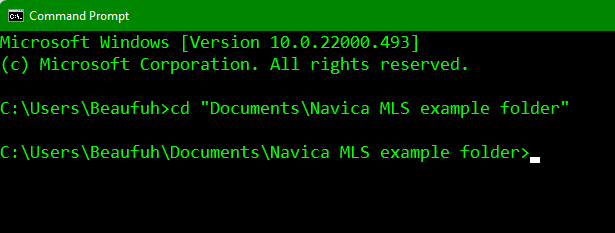
Open up a command line prompt and change directories to where you created the new folder.
Enter the command “main.py” followed by the url to lead pamphlet.
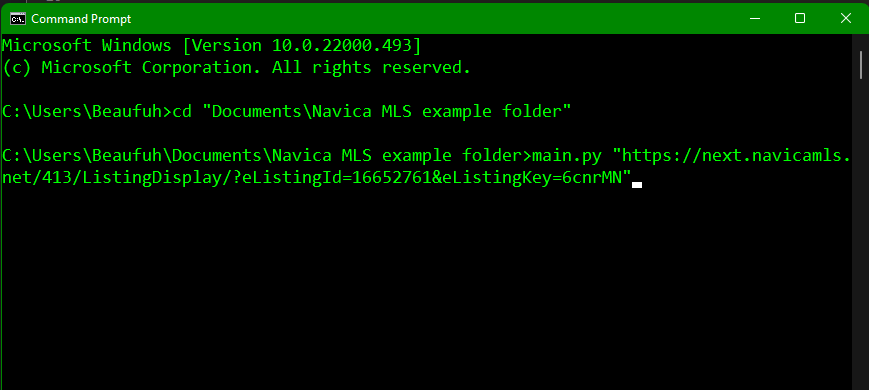
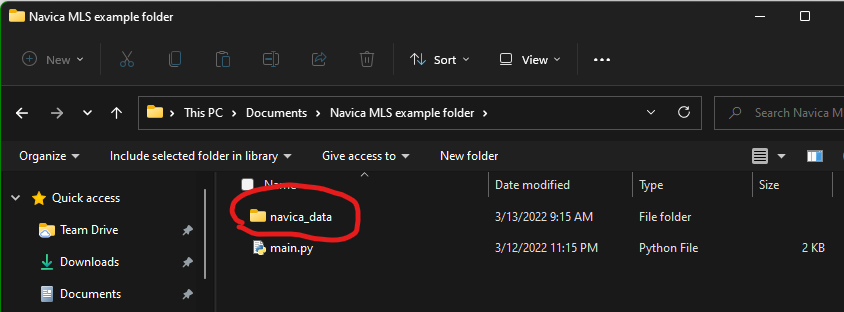
Hit enter to run the scipt. A new folder should then appear.
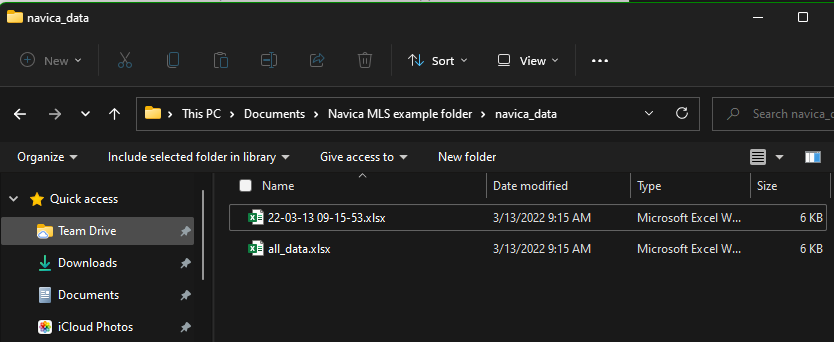
Open the new folder and view the contents. Two files should appear: an excel file containing a list of the leads pulled from the lead package you parsed with the python script in step 3, and an excel file contianing a list of all the leads pulled from the current lead package and any others previously parsed titled “all_data.xlsx”
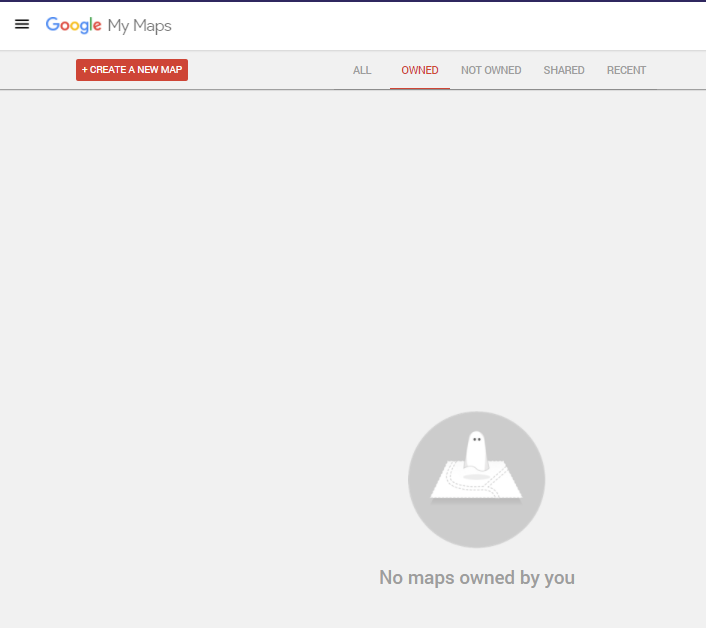
Open up Google My Maps and login with your gmail account. Once signed in, click create a new map.
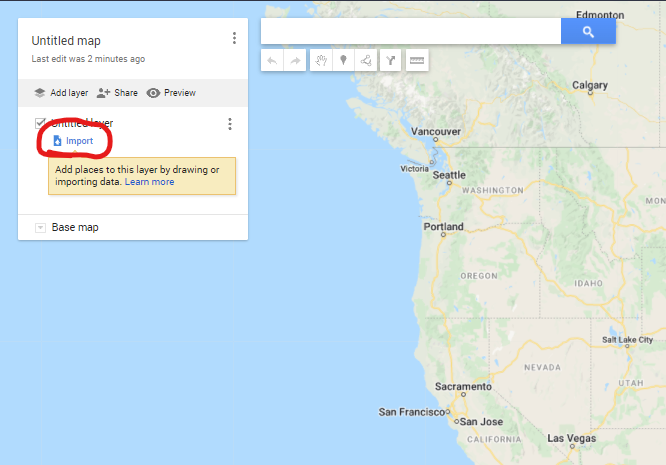
With your new map created, select the option to import data then drag and drop the “all_data.xlsx” file that we created in step 5.
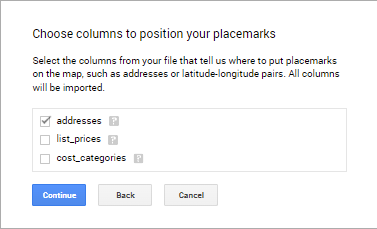
Now that your data is imported, we need to tell Google what column of our imported data table contains the location information; which in our case is the “address” column. Check this box, and hit continue.
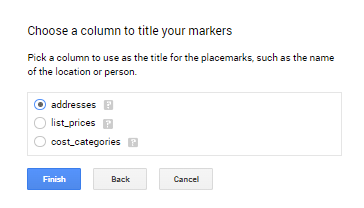
Next, we need to choose a column to title the markers. Then, click finish.
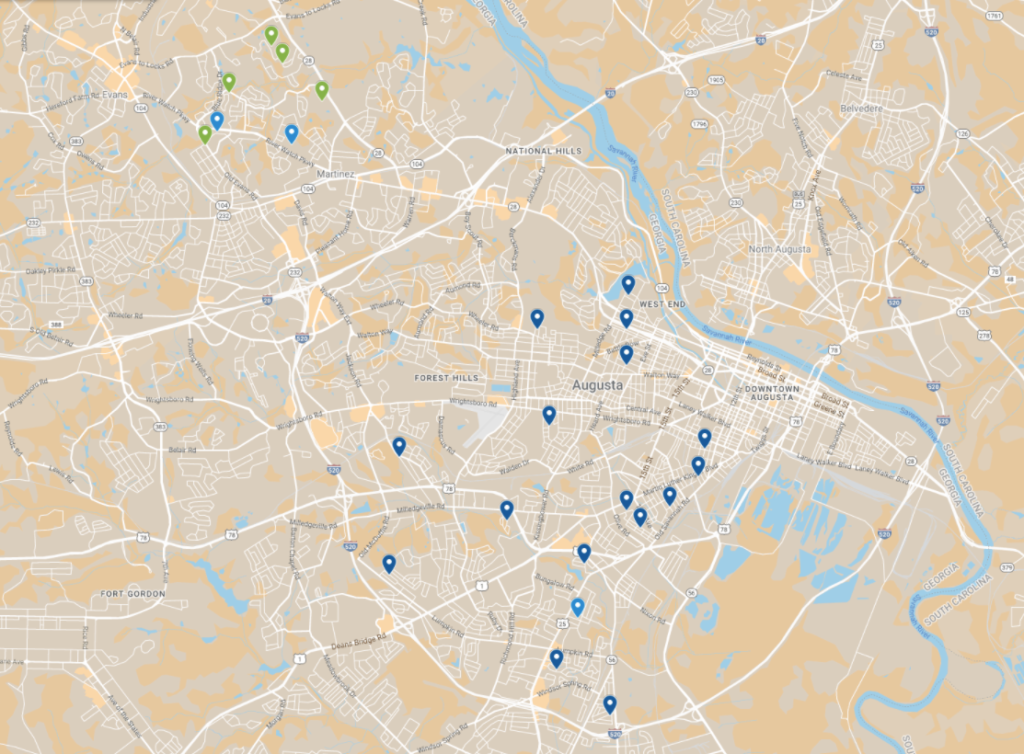
Our map has now been created and it should look something like this.
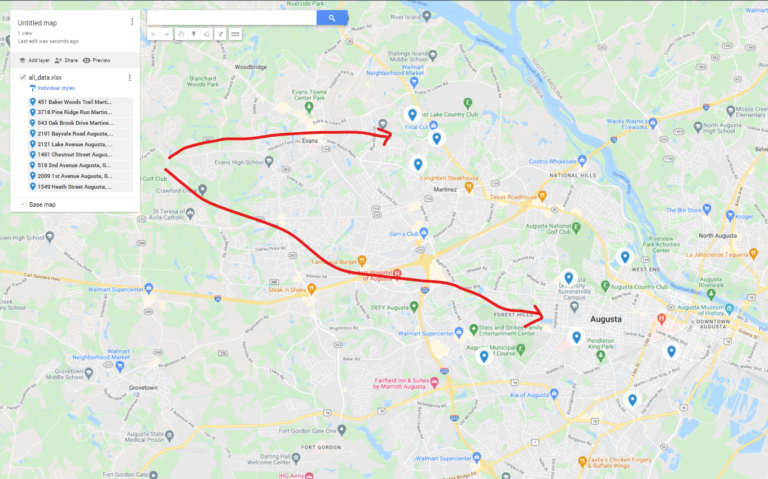
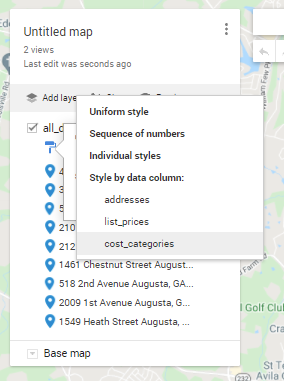
Now let’s color code our leads by price. As a part of our script, we have determined what leads are priced “low”, “medium”, and “high”. As such, we can now color code our pins based on this information. In your My Map control panel, under all_data.xlsx click the individual styles option and group places by cost_category.
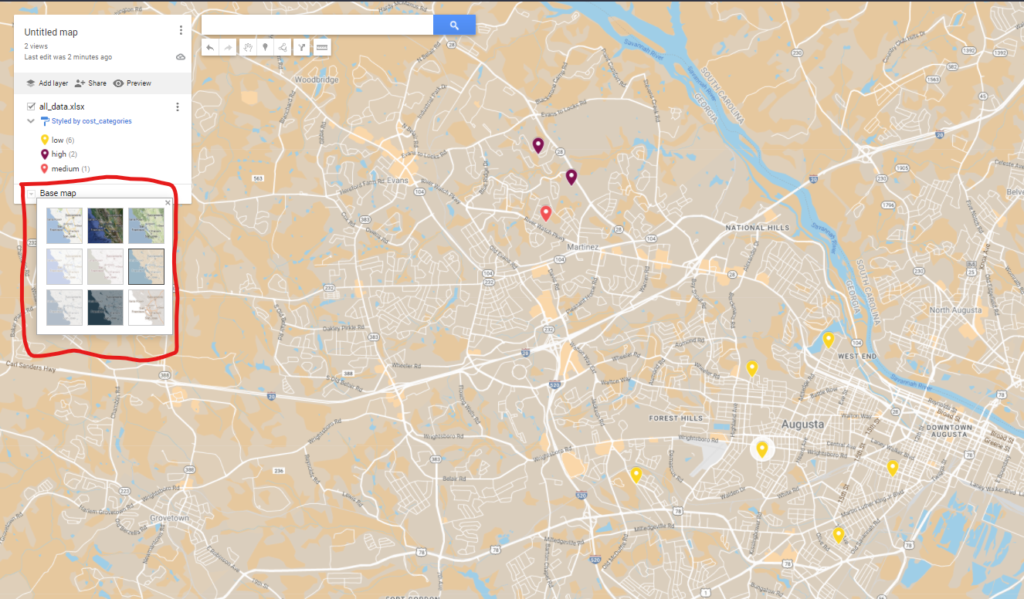
Your map now has your lead pins placed and each pin is color coded by price. Lastly, we need to change our base map so that our pins are easier to review. Personally, I like to use “Simple atlas”.
You have now successfuly parsed MLS data with Python and made a custom informative map to review the relative location of leads. Save your map by adding it to your Google drive and return to it in the future as needed.
If you like this content, subscribe to our email list in order to get notified about new post.